Reading time:
Last updated:
September 14, 2026
Digital out-of-home has spent most of its life as a reach medium. A screen in a station, a shopping centre or a commuter corridor is bought on location, estimated footfall, and broad assumptions about who passes it. That serves awareness campaigns well and has never worked convincingly for anything further down the funnel.
The obstacle is structural rather than commercial. There is no device in an out-of-home impression. A phone can be addressed directly. A television can be reached through a household connection. A screen on a street has no identifier attached to the people in front of it.
So the question in DOOH is never which person to reach. It is which screen, at which hour, is most likely to place a message in front of a particular kind of person. Audience mobility data is how that question gets answered, and the method has moved from theory into live market deployment.
HOW DOOH HAS TRADITIONALLY BEEN PLANNED
Conventional out-of-home planning rests on three inputs.
Location context comes first, meaning the assumed character of a place. A panel near a business district is treated as reaching professionals, one near a university as reaching students. Audience measurement panels and traffic counts come second, supplying estimated impressions for a site. Socio-demographic overlays come third, applying census or survey data about the surrounding area to infer who is likely to pass.
Each of these is an inference about a place rather than an observation about people, and all three describe an average rather than a moment. A panel's audience at half past eight in the morning and at seven in the evening can differ completely, and a single planning figure conceals that entirely.
WHAT AUDIENCE MOBILITY DATA CHANGES
Mobility data replaces assumption with observation. Rather than inferring who passes a location from what surrounds it, it uses observed movement patterns to describe which audiences are actually present, and when.
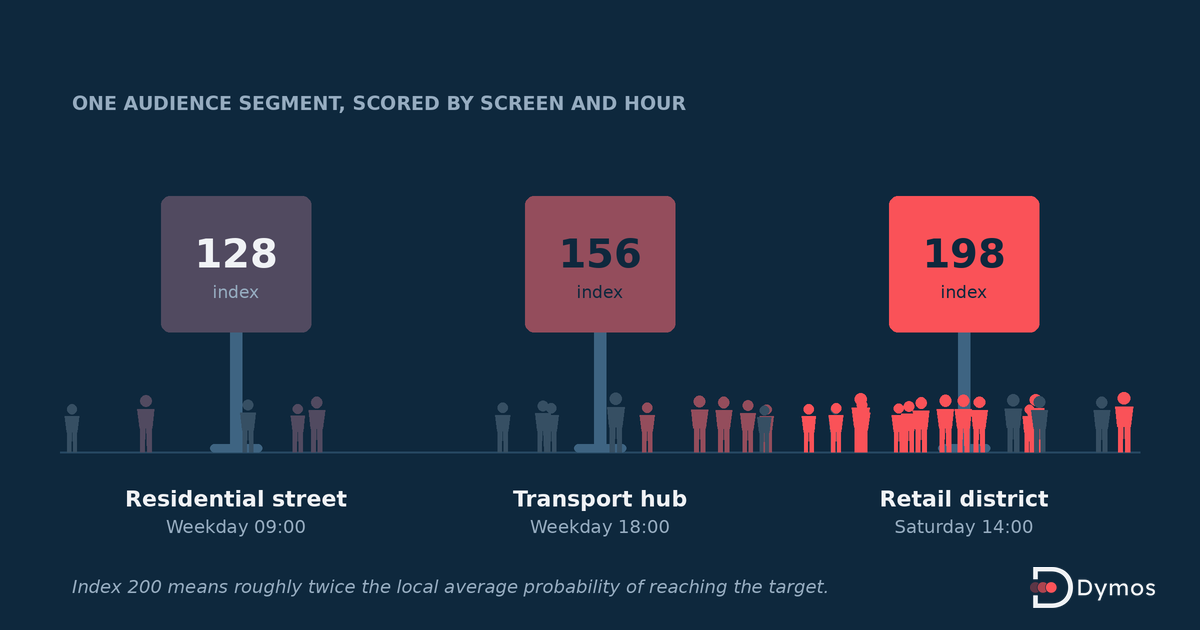
The output is not a list of people. It is a score attached to a screen and a time slot, describing how strongly a defined audience is represented among those who pass it relative to a local baseline.
This is the difference between saying a panel sits in a commuter corridor and saying that people who have recently shown interest in a specific purchase category over-index at that panel on weekday evenings. The second is actionable in a way the first is not.
SCREEN INDEXING AND THE AFFINITY INDEX
The usual expression of this is an affinity index.
A French deployment disclosed in trade coverage in October 2025 scored roughly 500 publisher-derived audience segments across more than 70,000 screens nationally, with indices generally ranging from 110 to 200. An index of 200 indicates the probability of reaching the target audience at that panel is approximately twice the local average.
Two things about that framing deserve emphasis. The index is relative rather than absolute, so it compares a screen against its surroundings rather than making a claim about an individual impression. And it is computed per time slot, because a screen is really many different audiences depending on the hour.
The stated aim in that deployment was strategic over-weighting rather than precise individual targeting, which is the honest ceiling of the medium and worth repeating to any client who arrives expecting one-to-one addressability on a billboard.
THE IDENTITY CHAIN BEHIND IT
Connecting an online audience to a physical screen requires resolving a mismatch that is easy to underestimate.
Publisher and advertiser audiences are typically anchored to email-derived identifiers from logged-in or CRM environments. Mobility is observed against mobile advertising identifiers, because movement is recorded on phones rather than in inboxes. Before any location analysis can begin, those two identifier spaces have to be reconciled, which is an identity resolution step rather than a location step.
Only then can observed movement be converted into audience composition by location and hour, and only then can that be expressed as scores a buying platform can act on. In the deployment referenced above, the scores were delivered directly into the DSP used by the buying team, so screen selection happened inside the normal programmatic workflow rather than as a separate planning exercise.
That last detail matters more than it sounds. Analysis delivered as a report becomes a document nobody opens twice. Analysis delivered as a structured matrix into a platform powers selection at scale.
WHY HOURLY GRANULARITY IS THE MINIMUM
A weekly average hides most of what makes the medium useful.
Retail locations, transport hubs, office districts and residential areas each follow different daily and weekly rhythms, and the audience passing a single screen can invert between morning and evening. An index computed across a full week blends those populations into something that describes none of them.
Hourly resolution across the whole week is the practical minimum. Anything coarser produces a plan that is right on average and wrong most of the time.
DOOH MEASUREMENT AND FOOTFALL ATTRIBUTION
The same data layer that informs screen selection also underpins measurement, which is where a good deal of current DOOH investment is going.
Footfall attribution compares visit patterns among audiences exposed to a campaign against a comparable unexposed group, producing an estimate of incremental visits. It is inherently probabilistic, since exposure in out-of-home cannot be confirmed at the individual level the way a click can, and any provider claiming otherwise is overstating what the medium supports.
Used carefully, it still answers the question clients most want answered, which is whether out-of-home spend produced store visits. Used carelessly, it produces confident numbers resting on weak assumptions. The distinguishing questions are how the control group is constructed, what the observation window is, and how exposure is estimated.
WHAT TO LOOK FOR IN A DOOH DATA PARTNER
Consistency between refreshes deserves as much attention as raw coverage. An index is a comparison against a local baseline, and thin or fluctuating data produces scores that move between cycles for no real-world reason, which forces a media plan to be rebuilt.
Time resolution should be hourly across the full week, and worth confirming rather than assuming.
Delivery should reach the buying platform in a structured form rather than arriving as a deck. Ask what the integration looks like in practice.
Market coverage should be reported by country rather than in aggregate, since a provider strong in one market may be thin in the one you are planning.
And the legal basis for processing should be documented in writing, which for European activity means a GDPR-compliant basis.
WHERE DOOH GOES FROM HERE
The direction of travel is convergence. Publishers and media groups hold audience data whose value has historically stopped at the edge of their own web and app environments, and out-of-home is one route for that data to earn revenue elsewhere. The same period has seen media groups acquiring out-of-home businesses outright.
For advertisers, the practical change is smaller than the language around it suggests, and more useful. Out-of-home stops being bought purely on assumptions about places and starts being bought on observed patterns about people, while remaining a medium that addresses crowds rather than individuals.
HOW DYMOS FITS
Dymos supplies the geolocation processing layer behind work of this kind, converting resolved identifiers into mobility patterns and then into structured scores that a planning or buying platform can act on, including in live programmatic DOOH deployments.
The same underlying capability sits behind brand, category, and geographic audience segments. Coverage is reported by market, data refreshes weekly, and European data is processed on a GDPR-compliant basis.
Frequently asked questions
FREQUENTLY ASKED QUESTIONS
What is DOOH advertising?
Digital out-of-home refers to advertising on digital screens in public and commercial spaces, including transport hubs, shopping centres, roadside panels and retail environments. Programmatic DOOH means buying that inventory through automated platforms rather than by direct negotiation.
How does DOOH targeting work without cookies or device IDs?
There is no identifier in an out-of-home impression, so targeting operates on screens and time slots rather than on people. Audience mobility data scores each screen according to which audiences pass it and when, and the buying platform selects screens accordingly.
What is DOOH screen indexing?
It is the scoring of individual screens by how strongly a defined audience is represented among those passing them, usually broken down by hour to reflect how a screen's audience changes through the day.
What does an affinity index of 200 mean?
In the deployment referenced here, indices generally ranged from 110 to 200, where 200 indicates the probability of reaching the target audience at that panel is roughly twice the local average.
Can DOOH target individuals?
No. Out-of-home addresses crowds. The methods described here improve which screens and hours are selected, which is strategic over-weighting rather than individual addressability.
How is DOOH campaign performance measured?
Commonly through footfall attribution, comparing visit behaviour among exposed audiences against a comparable unexposed group to estimate incremental visits. It is probabilistic by nature, since exposure cannot be confirmed individually.
What data is needed to plan DOOH with audience data?
Observed mobility resolved by location and by hour across the full week, a screen inventory with accurate positions, an identity resolution step where the source audience is email-based, and a refresh cadence frequent enough that scores remain stable between planning cycles.