Reading time:
Last updated:
September 16, 2026
Every retail client eventually asks the same question. The campaign ran, the impressions were delivered, but did anyone actually come to the shop?
Store visit attribution exists to answer it, and it has become a standard line in retail, quick service restaurant, automotive and out-of-home plans. It is also one of the more widely misunderstood measurements in advertising, because the confidence of the output rarely matches the strength of the method behind it.
Understanding how it is constructed is the difference between a measurement that informs a budget decision and a number that simply reassures everyone.
WHAT IS ACTUALLY BEING MEASURED
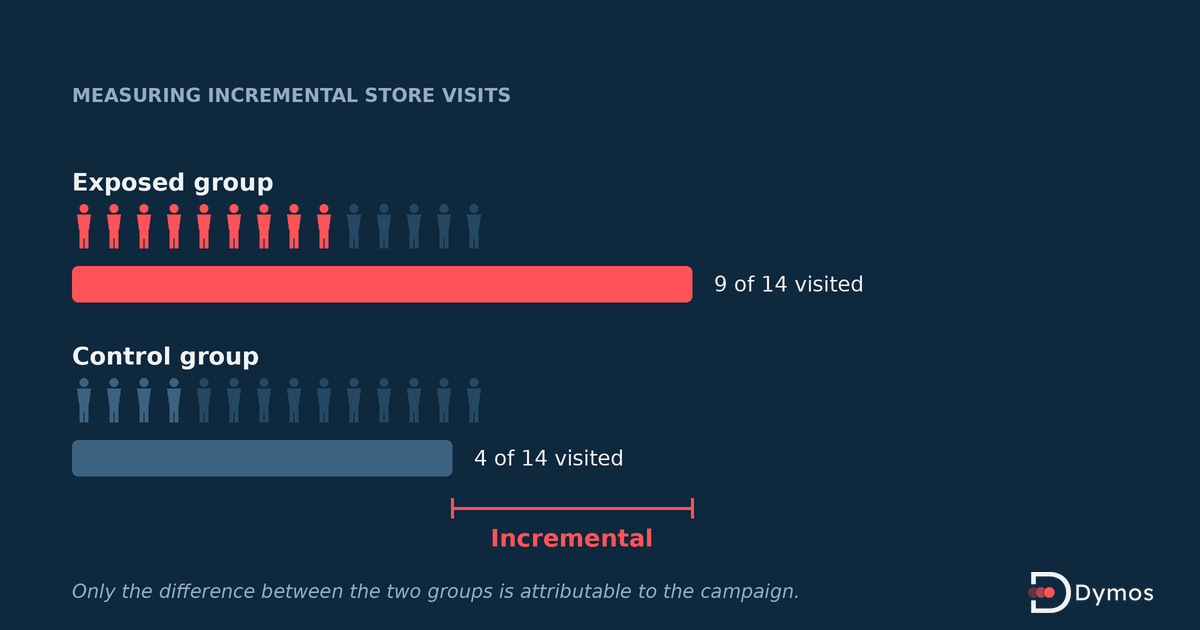
Store visit attribution estimates the incremental visits produced by a campaign. The word doing the work is incremental.
A raw count of how many exposed people later visited a store is close to meaningless on its own, because some of them would have visited anyway. A supermarket chain does not need advertising to bring regular customers through the door. The measurement only becomes useful when it isolates the visits that would not have happened otherwise.
That requires a comparison. Visit behaviour among an exposed audience is compared against a similar unexposed group, and the difference between the two is the estimate of incremental effect.
Everything that matters about the quality of a store visit study sits in how that comparison is constructed.
THE CONTROL GROUP IS THE WHOLE METHOD
If the exposed and unexposed groups differ in any way that also affects visiting behaviour, the result measures that difference rather than the campaign.
The common failure is geographic. If the exposed group skews toward people who live near a store and the control group does not, the study will report a large effect that reflects proximity rather than advertising. Campaign targeting usually creates exactly this skew, since media is often bought around store catchment areas in the first place.
There are other versions. Exposed audiences are frequently built from people who were already showing category interest, which makes them more likely to visit regardless of the campaign. Seasonality affects both groups but not always equally. And a control group drawn from a different app or data source than the exposed group can differ systematically for reasons nobody has examined.
A well-built study either matches the two groups on observable characteristics or uses randomised holdout, where a portion of the target audience is deliberately excluded from the campaign and measured alongside those who saw it. Holdout is the stronger method and the less commonly offered one, because it means deliberately not advertising to people, which clients often resist.
When evaluating a provider, how the control group is built is the first question and usually the most revealing.
WHY THE MEASUREMENT IS PROBABILISTIC
Even with a sound comparison, a store visit study is an estimate rather than a count, and no serious provider claims otherwise.
Exposure cannot be confirmed at the individual level the way a click can. An impression served to a device does not establish that a person saw it. In out-of-home this is particularly stark, since a screen has no identifier for the people in front of it, and presence within range of a panel is not the same as attention.
Visit determination has its own margin. Deciding that someone was inside a store rather than passing it, parked outside it, or in the shop next door depends on location precision that varies by device, by environment and by market. Dense urban areas with adjacent premises are harder than retail parks.
And the measured population is never the whole population. Only a share of visitors can be observed at all, so results are scaled from a sample. The scaling assumption deserves as much scrutiny as the sample itself.
None of this makes the measurement useless. It makes it directional, and directional evidence is genuinely valuable when the alternative is no evidence. The problem arises when a directional estimate is presented with the precision of a sales figure.
QUESTIONS WORTH ASKING BEFORE COMMISSIONING A STUDY
How is the control group constructed, and is it matched or randomised.
What share of visitors is actually observed, and how are results scaled to the full population.
How is a visit distinguished from passing by, and how does that change in dense urban locations compared with standalone sites.
What observation window is used after exposure, and does it fit the purchase cycle. A seven-day window suits grocery. It will understate automotive substantially.
And what is the minimum campaign size at which the study produces a stable result, because small campaigns frequently generate estimates whose confidence intervals are wide enough to include zero.
THE COMMERCIAL QUESTION NOBODY ASKS EARLY ENOUGH
Pricing structures for measurement vary more than the methods do, and the difference compounds.
Usage-based models charge per measured impression or per campaign, which looks inexpensive during a pilot and grows directly with media volume. Fixed data feed arrangements carry a higher entry cost and become considerably cheaper as measurement becomes routine.
For an agency measuring a handful of campaigns a year, usage pricing is usually right. For one that intends to offer measurement as a standard part of its service, per-usage costs can consume the margin on the very service being sold, which is why agencies building recurring measurement practices often move toward licensing the underlying data and building their own.
Model both against expected volume two years out rather than against the pilot.
WHERE THIS FITS ALONGSIDE OTHER MEASUREMENT
Store visit attribution answers one question well and others poorly.
It is strong evidence for whether a campaign moved physical footfall, and it is well suited to comparing two campaigns, two creative approaches, or two media channels against each other under the same method. Relative comparison is where it is most reliable, because methodological weaknesses apply equally to both sides.
It is weaker as an absolute figure and weakest when converted into revenue through an assumed basket value, since each assumption layered on top widens the error.
Used as a comparative tool it is one of the more useful measurements available in retail advertising. Used as a headline number in a board deck it invites a question nobody in the room can answer.
Frequently asked questions
FREQUENTLY ASKED QUESTIONS
What is store visit attribution?It is a measurement approach that estimates how many visits to a physical location were caused by an advertising campaign, by comparing visit behaviour among an exposed audience against a comparable unexposed group.
How accurate is store visit measurement?It is an estimate rather than a count. Exposure cannot be confirmed individually, visit determination depends on location precision that varies by environment, and results are scaled from an observed sample. It is best treated as directional evidence and is most reliable when comparing campaigns under the same method.
What is a control group in footfall measurement?A comparable group that did not see the campaign, used as the baseline for what would have happened anyway. It is either matched to the exposed group on observable characteristics or created through randomised holdout, where part of the target audience is deliberately excluded from the campaign.
What observation window should be used?It should match the purchase cycle of the category. Short windows suit grocery and quick service restaurants. Considered purchases such as vehicles or home improvement need considerably longer, and a short window will understate the effect.
Can out-of-home campaigns be measured this way?Yes, with the caveat that out-of-home exposure is estimated rather than confirmed, since a screen carries no identifier for the people in front of it. Presence within range of a panel is not the same as attention, and results should be read accordingly.